We Analysed 362 Commercial Buildings: Do More Waste Streams Lead to Better Recycling?
Content
- The number of waste streams is a strong driver of recycling performance;
- Each additional stream increases recycling rates by ~5–7 percentage points;
- Performance improves significantly up to 6–7 streams, then begins to stabilise;
- Most buildings operate with 4 core streams, which creates a performance ceiling. Additional streams drive further gains by capturing missed materials;
- Building size has no measurable impact, suggesting that performance is driven by system design;
- In retail environments, this relationship weakens, highlighting the role of behaviour.
Do More Waste Streams Lead to Better Recycling?
It’s a simple question.
If you give people more ways to separate waste, do recycling outcomes actually improve? Or do more bins just add complexity without impact?
We analysed 362 commercial office buildings across Australia, using Bintracker onsite weighing data to model the relationship between waste stream infrastructure and recycling performance.
The results were clear: yes, more waste streams are strongly associated with higher recycling rates. But the real story is far more interesting than simply “more bins = better recycling”.
1. What Most Buildings Already Have
Figure 1. Waste stream coverage in office buildings.
Nearly all office buildings operate with the same baseline system:
- General waste (100%)
- Mixed recycling (>90%)
- Paper/cardboard (>90%)
- Organics (>90%)
Beyond this, adoption drops:
- E-waste: ~48%
- Miscellaneous streams (i.e., Grease Trap, Coffee Cups etc.) : ~38%
- Specialised streams (i.e., Metals, Green Collect, Glass): very low adoption
Most office buildings operate with a similar set of core waste streams, which is why recycling performance often sits within a narrow range.
Higher-performing buildings tend to expand beyond this baseline, adding a few extra streams to capture waste that would otherwise go to landfill.
Keep Up-to-Date
- Latest @ Gurru
- Industry News
- ESG/Waste Regulation Updates
2. Not All Streams Are Equal
Figure 2. Average recycling rate and coverage by waste streams
The result suggests a clear tiered structure of waste management practices across commercial buildings:
- Core streams (i.e., General Waste, Mixed Recycling, Paper/Cardboard, and Organics) are widely adopted across buildings and form the baseline infrastructure, although they are associated with relatively lower recycling rates.
- Additional streams (i.e., E-waste, Plastic, and Miscellaneous), show moderate levels of adoption and are associated with improved recycling performance, indicating their potential to enhance outcomes beyond the baseline.
- Highly specialised streams (e.g., Glass, Metals, and Green Collect) exhibit higher average recycling rates, but are only present in a small number of buildings, limiting their general applicability
👉 In short, waste systems follow a clear hierarchy:
- Core streams → widely adopted, baseline performance;
- Additional streams → moderate adoption, strong performance uplift;
- Specialised streams → high impact, limited applicability;
This creates a practical approach: Strengthen the baseline → expand with targeted streams → avoid unnecessary complexity.
3. Do More Waste Streams Improve Recycling Rates?
Short answer: yes.
As the number of waste streams increases, recycling rates increase with it.
- 2–3 streams → ~25% recycling rate
- 8–9 streams → 60%+ recycling rate
GURRU INSIGHT
From what we see on sites, this pattern is consistent.
- Low stream systems rely heavily on user judgement, which leads to inconsistent sorting and higher contamination.
- As more targeted streams are introduced, the system becomes easier to navigate, reducing ambiguity and improving sorting accuracy.
Each additional stream lowers friction at the point of disposal, making correct behaviour more intuitive and repeatable.
That said, the spread within each group is still wide. Buildings with the same number of streams can perform very differently, which points to a second factor at play: how well the system is actually used.
Moreover, while recycling performance improves as streams are added, the rate of improvement begins to slow at higher stream counts. This hints at the presence of diminishing returns, rather than a simple linear relationship.
4. When More Is Not Better
Table 1. Waste Stream Number Ranking
To better quantify this trend, the relationship was modelled across all 362 buildings (See Table 1).
The results show a strong and statistically significant positive relationship, with each additional waste stream associated with an increase of approximately 5–7 percentage points in recycling rate.
While more streams improve performance, the relationship is not linear. The data shows:
- Strong gains between 3 and 6 streams
- Diminishing returns beyond 6–7 streams
GURRU INSIGHT
- Most recoverable materials are already captured.
- Too many streams increase decision fatigue and mis-sorting risk
- More streams require more space, more logistics and more management.
The goal is not simply to install as many streams as possible, but to design a waste system that maximises source separation, remains operationally practical and encourages consistent tenant participation.
In other words, better recycling outcomes come from smarter waste system design, not just more bins.
It is also important to recognise an underlying assumption in this analysis: the presence of a waste stream is taken as an indicator that it is being actively used. In practice, this may not always be the case. Where streams are installed but underutilised, the model may overestimate the impact of infrastructure on performance.
- 2–3 streams → ~25% recycling
- 6–7 streams → ~50% recycling
- 8–9 streams → 60%+ recycling
- +1 stream → ~5–7% uplift in recycling rate
👉 Key takeaway: Adding more streams consistently improves recycling performance, but the impact begins to level off beyond 6–7 streams, where system design should shift from expansion to optimisation.
5. Building Size Barely Mattered
To test whether building size influences recycling performance, Net Lettable Area (NLA) was included in the model and grouped into three categories (See Table 2):
- Small: <15,000 m² (90 buildings)
- Medium: 15,000–30,000 m² (86 buildings)
- Large: >30,000 m² (100 buildings)
Table 2. NLA Groups
After controlling for building size, the results show that the number of waste streams remains a strong and statistically significant predictor of recycling performance.
In contrast, there is no meaningful difference in recycling outcomes between small, medium, and large buildings.
GURRU INSIGHT
Larger buildings are often expected to perform better due to greater resources, space, and scale. However, from our observation, these advantages only create the potential for better outcomes, not the outcome itself.
👉 Key takeaway: Without the right system design and active management, larger assets frequently perform no better than smaller, well-optimised buildings.
6. What About Retail Sites?
The same relationship does not hold in retail environments.
Adding more streams does not consistently improve recycling outcomes. This is largely due to the way waste systems operate in retail environments.
Retail sites tend to have:
- Decentralised waste management, where individual tenants manage their own waste, limiting consistency and central oversight
- High tenant diversity, with different businesses generating very different waste profiles
- Lower engagement and accountability, often driven by staff turnover and limited training
As a result: In retail environments, recycling performance is primarily behaviour-driven rather than system-driven.
6. What This Means In Practice
Step 1: Establish and benchmark your baseline
Start by understanding:
- How many waste streams are in place
- What your current recycling performance looks like
Then compare this against the recycling rate of similar waste stream setups in Table 1. This helps determine whether the constraint is infrastructure or performance.
Step 2: Diagnose and optimise the current system
If performance is low, focus on contamination, bin placement, and usage before adding complexity.
Step 3: Expand infrastructure strategically
Once performance is stabilised, introduce additional streams to capture missed materials. A staged approach allows each addition to deliver measurable impact.
Step 4: Optimise within range and continuously refine
Operate within the optimal 6–7 stream range and adjust over time based on performance data.
GURRU INSIGHT
Adding streams is effective, but timing matters.
Add more streams when:
- Performance is at or above expected levels
- Recoverable materials are still going to landfill
- Existing streams are used correctly
Avoid adding streams when:
- Performance is below benchmark
- Contamination is high
- The system is already difficult to use
👉 Rule of thumb: Only expand once the current system is working.
The best-performing buildings don’t have the most streams, they have the right ones.
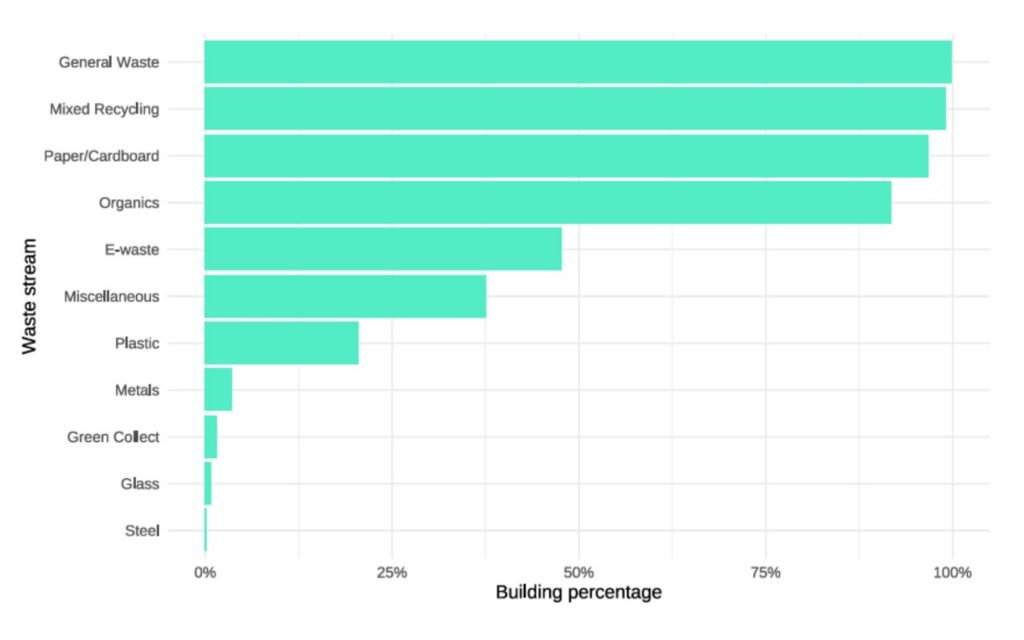
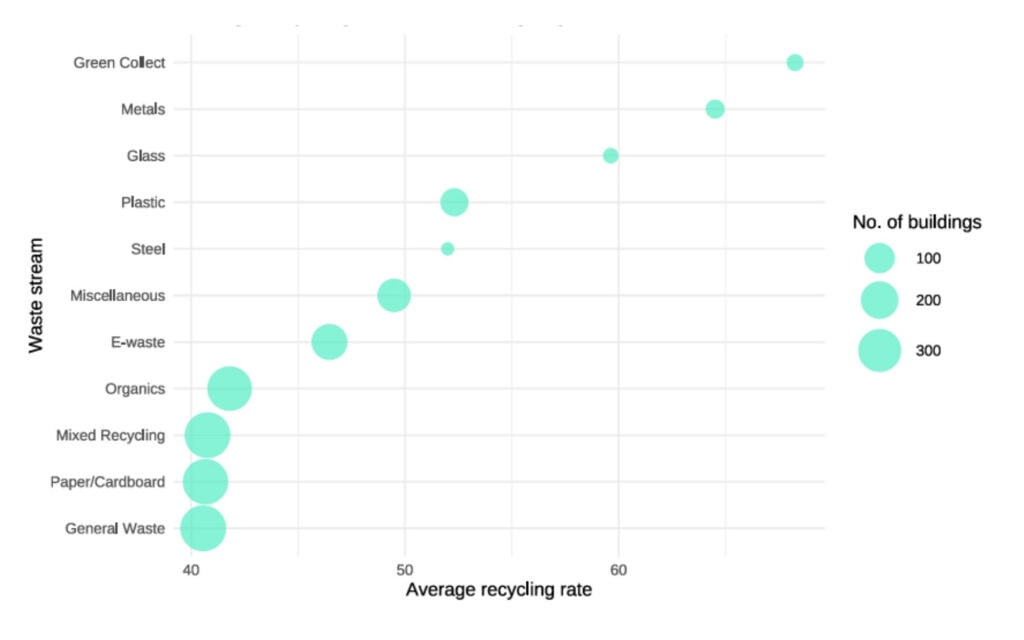
More waste streams lead to better recycling outcomes. Adding more streams improves outcomes by enabling better source separation. But the impact is not unlimited, and results depend on how effectively systems are used.
This is where visibility becomes critical. Without data, it’s difficult to know:
- where waste is being lost
- how systems are performing
- what to improve next
With the right insight, waste becomes something that can be actively managed. This is where Bintracker performs best.
If you want to understand how your building compares and where the biggest opportunity sits, check out Bintracker or talk to the Gurru team today.
More Like This
Discover how NABERS Waste works, rating criteria, costs, data requirements, and strategies to improve your score. A full guide for building owners & FMs.

Australia’s waste and recycling system is changing quickly, with new policies and initiatives affecting how we handle resources. In this edition of the Word on Waste Newsletter, learn about the latest industry updates, including important reductions in food waste and increasing waste fees. Discover the hidden effects of microplastics on our environment and health, along with tips to cut down on plastic use in your daily life.

Breaking down what reliable waste reporting means for NABERS, why it matters, and how better data can support stronger performance better results.